From Online to Desktop, Berlin to Bangkok – Here is how your support made a difference
“As we come to the end of another extraordinary year, I want to extend a heartfelt thank you to our customers, partners, community and of
Collabora Online is a powerful online document editing suite. Integrate into your own infrastructure or access via one of our trusted hosting partners.
View and edit your documents as a team – text, spreadsheets, presentations and drawings.

Simple integration with other applications and your own.

Compatible with trillions of documents including Microsoft, open and more.

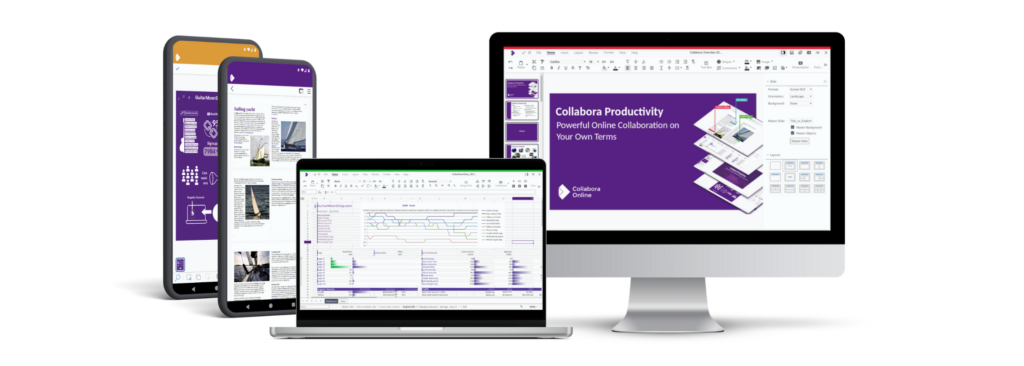
Online, desktop and mobile apps for productivity wherever you need it.

GDPR compliant with SLA and Support.

With an active global community.


Collabora Online is an Open Source document editor, designed to be easily integrated into a multitude of solutions. Whether you are sending emails, storing files, empowering education or streamlining business applications, if your product wants documents, you need Collabora Online.
Enterprise file sync and share users can preview, edit, and collaborate on documents directly inside the file-sharing environment.
Adds fully-featured office document editing inside your project-management/email/calendar/productivity platforms.
Learning management systems allow students and teachers to collaborate on assignments, feedback forms, and shared documents in real-time.
Teams can work together on documents within the internal platform—secure, auditable, and self-hosted.
If your app stores or generates documents, Collabora Online can be embedded to let users view/edit them without leaving your app.
Collabora Online integrations combine all the power of our document editor, with another application (or multiple applications). This approach allows end users to enjoy a more coherent working environment, with all their apps working together.
We work with more than 200 partners around the world, providing Collabora Online for millions of users.
✔ Partners handle the complex aspects of integrations, migrations, and hosting.
✔ Choose a partner aligned to your needs.
✔ Combine with many other tools for a complete groupware solution.
Get in touch for a quote, ask a question or sign up to the newsletter so you don’t miss out on all the latest news.

Empower your users with powerful document editing capabilities, easily integrated into your existing platform.
✔ Free to test
✔ Easy to integrate
✔ Customise for your platform


Webinar: Introducing the New Collabora Office
03/12/25 15:00 CET
Webinar: How to Choose the Right Collabora Products
29/01/26 15:00 CET
Webinar: Introduction to Collabora Online
17/07/25 15:00 CEST
Webinar: Introducing the New Collabora Office | 3 December 2025 – Online
Nextcloud Enterprise Day | 9 December 2025 – Paris
Open Source Experience | 10-11 December 2025 – Paris
Webinar: Indryve × Collabora: Sovereign Office & Collaboration | 18 December 2025 – Online
Univention Summit | 28-29 January 2026 – Bremen
Webinar: How to Choose the Right Collabora Products | 29 January 2026 – Online
COOL Days 2026 | 27-29 April 2026 – Hamburg

“As we come to the end of another extraordinary year, I want to extend a heartfelt thank you to our customers, partners, community and of

Welcome back to our interview series, where we chat with the passionate people behind the Collabora Online code. Collabora Online is made possible by the

Denmark tried to legislate open source and Big Tech pushed back hard. Nearly 20 years later, open-source solutions are running citizen services in municipalities across the country and even powering the tax authority in Greenland.
In this episode, Magenta CEO Morten Kjærsgaard explains Denmark’s “first wave” and “second wave” of open-source adoption, and how open-source companies across Europe are now working together to build truly sovereign public-sector technology.

Same look. Same code.Your files, your device. We’re excited to share the first release of the new Collabora Office for desktop – bringing the familiar,